Statewide :: News & Press :: Interactive Map :: Map Poster :: About the Map :: Landsat Lake Images
| More
About the Science |
||
|
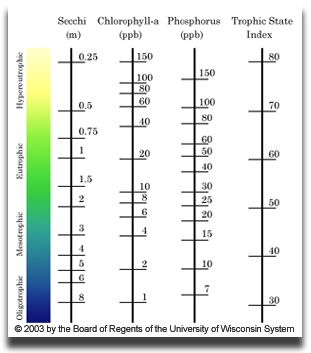
Clarity and Trophic State Clarity is a common, but indirect, way to roughly estimate the “trophic” or nutritional condition of the lake. Researchers use various methods to calculate the trophic state of lakes. Common characteristics used in combination to make the determination are:
|
 |
|
|
More
about Satellite Remote Sensing The instruments on Landsat-5 and -7, known as the “Thematic Mapper” (TM) and “Enhanced Thematic Mapper Plus” (ETM+), respectively, measure spectral radiance, or reflected sunlight coming from the Earth’s surface, in several wavelength bands or channels. For Wisconsin’s lakes, the clarity of water is indicated by the combination of spectral radiance in two Landsat bands, numbers 1 and 3 (sensitive to blue and red wavelengths of light, respectively). In these bands, the sensors are able to record features on the landscape as small as 30 by 30 meters (98 by 98 feet) in size. While very small objects such as cars and people cannot be seen by Landsat, larger features such as lakes can be readily observed. Each satellite image is a grid of millions of these 30-meter pixels. It takes 160 million such pixels to produce a mosaicked statewide image. |
Researchers developed statistical models to describe the relationship between the field observations of secchi disk transparency and the digital satellite measurements of spectral radiance, for a set of 371 “training” lakes. Researchers then applied these regression models to the image data for all other lakes in the satellite’s field of view, yielding estimates of water clarity for the thousands of lakes that were not sampled by volunteers. Finally, the scientists used an additional 226 volunteer-sampled lakes to check the accuracy of the satellite estimates. For this map, researchers generated a single water clarity estimate for each lake based on the average reading at the lakes’ deepest basin. However, it is also possible to use the models to calculate the clarity of every 30-meter pixel, providing information on the internal variability in water clarity within each lake. | |